


Gantt Chart
A full-function Gantt Chart for EA
Create intelligent project plans in EA, integrated with all your EA model data. Dynamically schedule tasks and milestones using Gantt charts, with an intuitive UI to structure, manage and edit projects and linked deliverables.
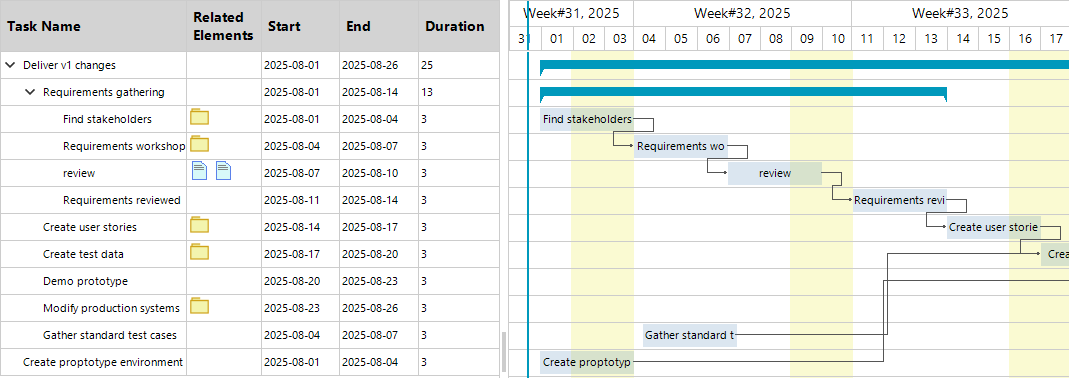
Two-Pane View
Left pane — Task list
- Shows the main fields: Task name, Related elements, Start date, End date, and Duration (whole days).
- Rows are hierarchical. Parent rows take their start and end dates from their children.
- All dates are normalized to full days: start at 00:00 and end at 00:00 on the next day.
- When you edit a value in the grid, the change is shown immediately in the bar lengths on the right.
Right pane — Timeline (Gantt chart)
- Each task appears as a bar; milestones appear as diamonds.
- Weekends are visually different, and a “Today” line helps you see current progress.
- Use zoom and horizontal scroll to move around large plans.
- When the chart opens, it positions the left edge at the project’s earliest start date so the beginning is visible.
- Selecting a row highlights the matching bar, and selecting a bar highlights the matching row. Both panes stay in sync.
Dependencies and EA links
- Finish-to-Start dependencies are enforced. If a predecessor moves, its successors recalculate automatically.
- Icons in the grid link to related EA elements (for example: requirement, risk, issue). Tooltips and quick links let you jump back to EA.
Common actions
- Add or delete a task
- Add a child task
- Add a milestone
- Move tasks
- Change task level (indent or outdent)
- Access these actions from the toolbar and the right-click (context) menu.
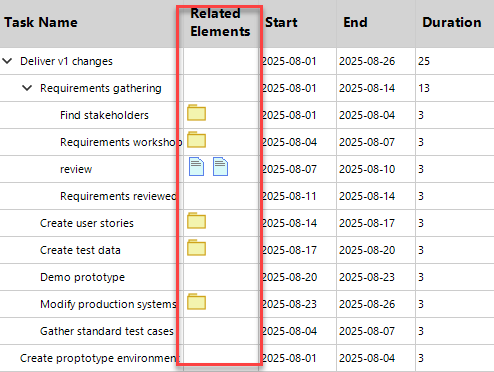
Related Elements column
- Shows all items linked to a task at a glance.
- Each link appears as a small icon (Requirement, Risk, Issue, Test).
- Hover to see a tooltip with the item’s name and status.
- Click an icon to open it in EA (Enterprise Architect) or the details pane—jump straight from plan to model.
- If there are several links, icons are grouped and a small badge shows the count.
This keeps the grid tidy and makes links easy to understand. You can quickly see which tasks deliver requirements, reduce risks, or are verified by tests—without leaving the Gantt.
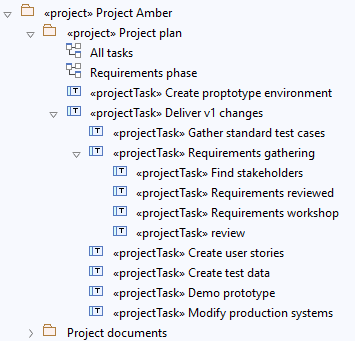
Project Plan in the EA Project Browser
In EA’s Project Browser, the plan shows as a clear tree. A “Project Plan” package (or similar) sits at the top. Parent tasks are top-level items; child tasks are indented underneath. This structure matches the Gantt’s left pane, so expanding a parent shows its work breakdown quickly.
If you add Work Breakdown Structure (WBS) codes to task names (for example, “1.2.3 Build UI”), the order stays clear even outside the chart.
From any task in the tree, you can open Traceability to see linked Requirements, Risks, Issues, and Tests. These links are the same ones shown in the Related Elements column, making it easy to move between the plan and the model.
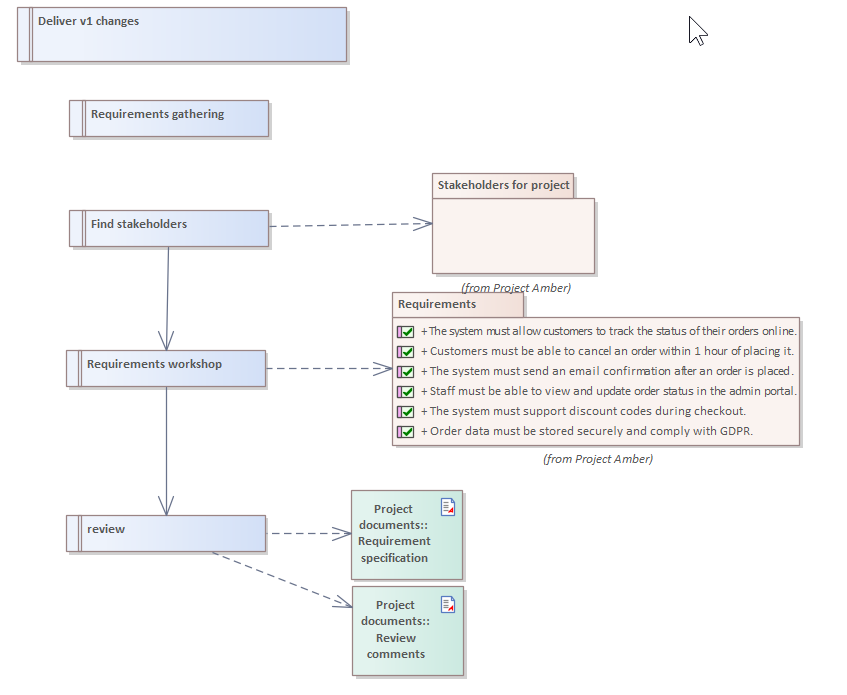
Gantt charts fully integrated within EA
The Gantt chart is now fully integrated with all your modeling.
Make use of all the great diagrams which EA already offers to link project tasks to other elements.
To link a Task to something else, just create a ‘Dependency’ connector, and the Project Builder Gantt Chart will show those elements in the ‘Related Elements’ column.
Did you know, we also offer Sparx EA consultancy and mentoring?
We offer a variety of mentoring and consultancy options, to support you with the skills you need to use Sparx EA efficiently in your business. Our goal is to bring clarity to your modelling, share solutions and equip you with insights, so that you can use the software more effectively.
Learn More
Download Portfolio Manager
Take a free, no obligation, 30-day trial of Portfolio Manager. Portfolio Manager is part of eaTeamWorks, so you can also trial eaDocX, Revision Manager, eaSheets and Model Expert. Plus free for life modeling features. Discover for yourself the difference that Portfolio Manager real-time impact analysis will make to your EA modelling.
Download