


The role of diagrams in Enterprise Architect
Not every modeling problem can be solved with a diagram. Some diagrams are essential, some are useful, but some may be misleading. Ian reviews how we can tell the difference.
A controversial topic
I received a lot of feedback from my presentation at the Global Summit this year – some positive, some not so positive – but I think a few listeners may have misunderstood what I was trying to say.
I used the example of some Archimate diagrams which I didn’t think were useful – i.e. need to be used with care – which some listeners understood to be an attack on the Archimate language. That was absolutely not what I intended. I have lots of examples of diagrams which need to be used with care in lots of other modeling languages and business domains too. And I’ve created many of them!
OK, so I was being a bit controversial, but only to make a point.
My main idea was that just because we use a visual modeling tool like EA does not mean that everything we model has to appear in a diagram.
And if the modeling language that we use is a complex one – such as Archimate – then we need to be especially careful about which parts of the language we choose to use.
I also suggested that there are some kinds of diagram which we should actively avoid, and use on-the-fly mechanisms to view that data, where we can be sure we’re looking at the latest, most complete set of model information.
What I was trying to say was that diagrams have a specific place in the use of modeling tools, and that they are not the only, and sometimes not the best, way of viewing model information.
(Whilst diagrams are the primary modeling interface in Enterprise Architect, it also provides list, traceability and tree views which are helpful for various types of data.)
I’m going to suggest that the diagrams which we draw in our modeling tools sit on a spectrum:
- from the most useful, where the diagram content is absolutely vital to how we model
- through some which are maybe useful, and maybe not,
- and on to those where the diagram really isn’t useful at all.

Essential diagrams
First let’s look at the useful end.
In a model there are some kinds of information which it would be impossible to imagine being expressed in any other way than a diagram.
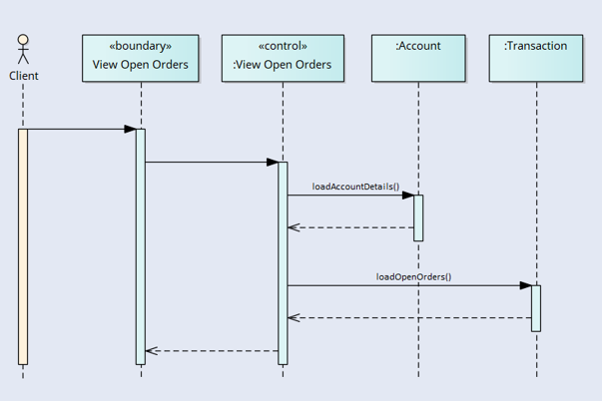
The best examples are probably process flow or activity diagrams and sequence diagrams.
For this kind of information the spatial relationship which we can see in a diagram is absolutely essential to understanding that information. Try to imagine a sequence diagram expressed just as text – it’s clearly impossible.
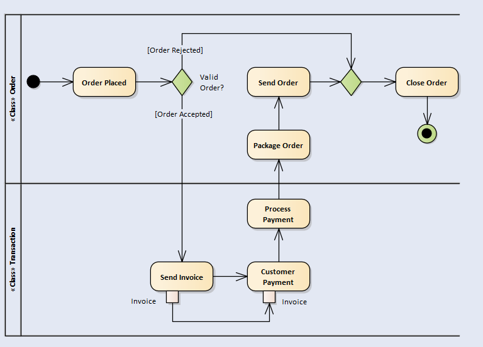
The same is true for diagrams which have a sense of ‘flow’ to them, such as all kinds of UML Activity diagram, and especially process flow diagrams.
Here, we are describing a story of how something gets done, and stories have a sequence from start to finish, and the flow helps us to see where there may be missing steps or incorrect flows.
So these kinds of diagrams are definitely 100% at the ‘useful’ end of the spectrum.
(Below, I will explore what happens to diagrams when we delete ‘things’ and connections, and when we add them.)
Diagrams like this don’t have much of a problem with these kinds of changes. If I delete an activity (process step) from my model (and don’t stop to check which diagrams used it) then my process diagram will have a big hole in it, which will be obvious. If I add a new step, then I really will have to insert it into the flow somewhere, otherwise what’s the point? So model changes are handled quite naturally in these kinds of diagrams.
In the middle
So if we think that sequence and process diagrams are essential, then what kinds of diagrams might we put in the middle of this spectrum? By that I mean situations where the diagram is useful but also where a textual view can also add value.
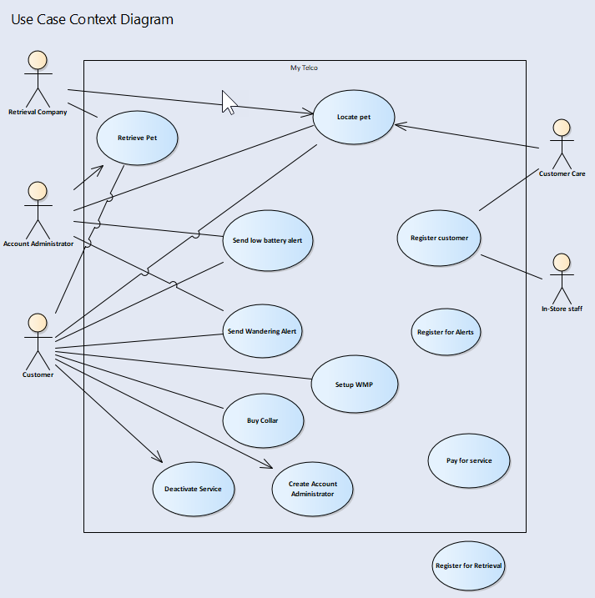
An example of this might be a static diagram – for example a UML use case diagram.
I’m personally quite invested in this kind of diagram. When I was a business analyst I spent many years drawing them, and as a teacher, more than 10 years teaching other people to use them.
Here, the diagram seems at first glance to be essential. The diagram shows information which a simple textual view cannot. I tend to put the ‘customer’ type actors on the left, and the ‘internal’ or system actors on the right. I also tend to put the more important use cases at the top of the diagram. I also put some use cases outside the box – which represents the system scope – to indicate that these are out-of-scope.
By drawing a diagram here we are helping the user to understand the information better. OK, so this comes at a price.
I spent quite a bit of time making this diagram look nice, with minimal crossing lines, and also so that it would fit into an A4 page in a document.
I’m very pleased with this diagram – it’s one I use when teaching people about UML use case models diagrams – and I couldn’t imagine being without it.
So why do we need a textual view?
So if the diagram for this kind of data is so useful why do we even think about using a textual view as well?
We know, because we are users of models, that any diagram like this is just a view into some underlying data. This is what differentiates drawing tools from modeling tools: modeling tools maintain a robust model which is independent of any diagram, and allow us to draw views onto that model which we call diagrams.
Those diagrams are still views. They show only a subset of data: a subset of the ‘things’ and a subset of the connections between the ‘things’.
This is what gives them some of their power. They allow the author to select what information appears, to suit the consumers of the diagram and the point that they are trying to make.
The downside of any diagram is exactly the same. It is a subset of the information in the model and so we need to remember that this is so.
If a diagram is obviously a view then we need to make it obvious to the consumer that they are looking at a subset. If a diagram suggests that it is showing everything in, for example, the ‘use case model’ then this is where the problems begin.
The delete problem - fixed
Tools like Enterprise Architect are very good at updating diagrams when elements have been deleted. So if my diagram says “here are all the entities”, and one has been removed from the model then that entity will disappear from all diagrams. This is excellent, and yet another reason to use a modelling tool and not a drawing tool.
Adding new connections - partly fixed
Good modelling tools will also update diagrams to show where new connections have been created, so long as both ends of the connection are already in the diagram. So if we create a new connection, and one of the ends is not in the diagram, then maybe our diagram is a bit misleading: we intended the diagram to show, for example, all the use cases for a specific actor, and because we haven’t connected that actor to an existing use case, now it doesn’t.
The ‘add new’ problem - not fixed
The trouble really starts when we add new data
If my diagram says it’s ‘All the use cases’, I must remember to update it whenever I add a new use case. (more hours trying to fit it into my otherwise beautiful layout).
And this applies to any other diagrams where my new use case appears. If I don’t, then my ‘All the use cases’ diagram is back to being just another view – and an inaccurate one
This may not be obvious to the reader when they look at the heading of the diagram and it says ‘All the use cases’.
Unless I remember to add the new data, then this diagram is just wrong.
So it is for this class of diagram where a view which is created in real time can be very useful as well. I’ll call these ‘immediate views’.
"Immediate Views"
You have come across this idea already. If you have ever created a chart in Excel, then you’ll know that one of the coolest things is that if you change the data, the chart will (usually) update as well. OK, so not always – you may not have the right ranges selected, but if you thought about this in advance, then the update will work brilliantly.
Image if, instead of getting Excel to draw the chart, you went into Visio and drew the bar chart rectangles by hand. That would be crazy. No more immediate updates, and you just created a maintenance problem.
So it’s a property of what I’m going to call ‘immediate views’ that they DO get updated, with little or no effort.
Because immediate views are created in real time, from the very latest data, we can be sure that we are looking at a complete set of data.
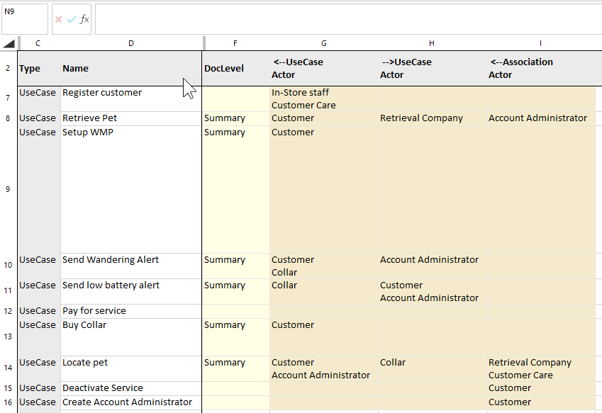
So for example, if our immediate view is a spreadsheet, when we open a spreadsheet on the package which contains all the use cases, then we will see all the use cases.
OK, so we have lost the spatial arrangement of those use cases but at least we have all the data.
My suggestion is therefore that for this class of data – where the special arrangement of ‘things’ and connections is helpful, but not essential, then there is a useful role for ‘immediate’ views, to serve as a cross-check.
eaSheets provides a dynamic view of this kind of model data
Synthetic diagrams
If you have been a modeling tool user for a while then you have probably thought about, or even created, some way to auto-create diagrams.
If you have, then you will know that this is a really hard problem. Putting the things into a diagram, and hopefully having your modeling tool draw all the connections is the easy part.
Recreating that helpful spatial arrangement is much, much harder.
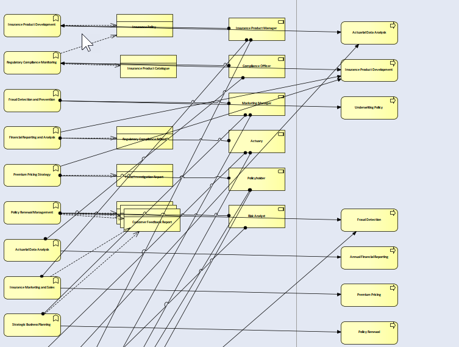
Example of a synthetic diagram. Not very pretty.
The other issue with synthetic diagrams is that we need to remember to update them when new data is added.
This doesn’t really solve the problem, unless we have so many synthetic diagrams that manual updating is not a problem, and automatic re-creating of the lots of diagrams is economic.
Less useful diagrams
If some diagrams are essential, and some others are kind-of useful, then are there diagrams which are really not useful at all?
In thinking about this article, I went back through a number of models which I’ve produced over the last 20 years, and looked critically at whether each diagram was worth the effort which I put in.
Lots of them were definitely worth it. They showed some aspect of the business problem which could not have been shown any other way. I also checked, and quite a few of them were not up-to-date, which was a surprise.
Lots more were in the maybe-useful category, and others were just really not useful.
More Insights
The eaTeamWorks product philosophy
22 November 2023
The eaTeamWorks product philosophy is simple - and it's all about you, the modeler.
Learn MoreExplaining modelling
22 June 2023
..or, "how to reduce 20 years of modelling into 5 bullets". If you need to explain to someone what we do, try this short explanation.
Learn MoreWhere to start modelling
22 June 2023
Faced with an empty model and a problem to solve, where should you start? Some advice for people with no modelling experience
Learn MoreCreating useful, long-lasting process models
22 June 2023
Process models are hard to maintain. Maybe that's because they have poor structure. Here are some ways to give them a longer life.
Learn MoreeaTeamWorks Launch: What does this change mean for me?
15 June 2023
Information for existing eaDocX, Model Expert and Portfolio Manager license holders
Learn MoreCreate useful models using Sparx EA
1 June 2023
Advice for the new modeller #3 - Producing useful outputs with your new EA tool.
Learn MoreWhat needs to be included in your EA model content?
1 June 2023
Advice for the new modeller #4 – (not) Modelling The World
Learn MoreBeginners guide to Enterprise Architect software
1 June 2023
Our advice for new EA modellers
Learn MoreHow much domain modelling is enough?
1 June 2023
Advice for the new modeller #2 – (not) Melting the Pan
Learn MoreSimplifying ideas in a BPMN Process Diagram
1 June 2023
How to find the right number of ideas to include in your model.
Learn MoreBeck’s Map: an EA model abstraction example
1 June 2023
Possibly the best model abstraction in the world
Learn MoreProcess based model styles
1 June 2023
How to use BPMN and UML to make models which last.
Learn MoreWhere to start with Enterprise Architect data modeling
1 June 2023
BPM Tips: Advice for the new modeler #1
Learn MoreReading diagrams
1 June 2023
Why some diagrams are better than others, how to present diagrams, and how big or small to make them
Learn MorePutting EA at the heart of your business
1 June 2023
Ian's workshop at the EA Global Summit on September 14th 2022
Learn More
Download a free trial
Download eaTeamWorks today for free for life features, plus no obligation, 30-day trials of all the products: eaDocX, Revision Manager, eaSheets, Model Expert and PortfolioManager. Discover for yourself why eaTeamWorks is the world’s best-selling Enterprise Architect extension.
Download