


Imports, Implications and Insights – Global Summit 2023
The video and transcript from Ian's presentation to the EA Global Summit 2023, describing 3 ways to deliver even more business value from your EA data
Summary
In this video Ian describes a journey:
• from trying to find a way to help people import data into EA a bit better,
• via creating a general-purpose editor, and validating the data easily,
• to what does this mean for the way we use EA?
The notes below provide a summary of the topics Ian covers in the presentation.
P.S. The video is annotated with chapters so you can easily navigate to the parts that you want to watch
Setting the Scene: Principles
What are the principles that we use at Ability Engineering when building solutions for people?
- Everything is for modelers. So, make it possible to do everything you need to without needing to write programs, sequel, or scripts (although you can if you want!).
- Minimize the impact on infrastructure.
- Any solution needs to work with any kind of modeling language and any kind of modeling style. Good, bad, or in between.
- Meet our stakeholders where they are rather than where we’d like them to be. So we improve what they can see and do without forcing change on them.
- Remember that EA is not the center of the world, just a part of a big IT world. So, we need to play nicely with everything around us.
- Finally, value for money. So, keep it simple and keep it real.
Journey part 1: Importing information
Importing complex information into EA is hard. EA expects things to be nice little regular pieces, nice little boxes all lined up nicely and all beautiful. But our data is often not like that. It’s not very well organized and it’s got all kinds of extra stuff in it. The things that I do want and don’t want are all in together, and it’s not structured in the way that EA needs.
As an example, a mixture of ArchiMate business functions, including names and notes, plus other things that each business function is related to. That might be a problem because in EA terms, those are going to be different elements and they’re going to be linked to my business functions with connectors. With data coming from multiple spreadsheets. But what EA wants to see is more structured, third normal form, classic database design: separate tables for each element type and then tables with the relationships between them.
So what are the current solutions?
- The Office MDG, which is great. It does import and export from Excel. But it’s hard because we need to define a profile for each kind of file, each spreadsheet that says how each piece maps onto each other piece. It needs a lot of careful attention to get right and can be very difficult to import data from denormalized tables including names of elements and all the things they are related to.
- Write some script. Great, but that creates technical debt. Either it means that one of your modelers is going to take time out from writing models and doing their job to learn how to write script, or you’re going to hire somebody from the outside and there’s your technical debt.
- Or a spreadsheet control inside EA which combines a bi-directional interface AND smart columns, columns which know if the data is a tagged value, or an EA field, or the name of the of the element or information about something related to the element. This function is in eaSheets™ & builds on the experience gained from the Excel interface previously included in eaDocX™.
PS eaSheets and eaDocX are now part of eaTeamWorks™.
Step by step importing complex data with eaSheets
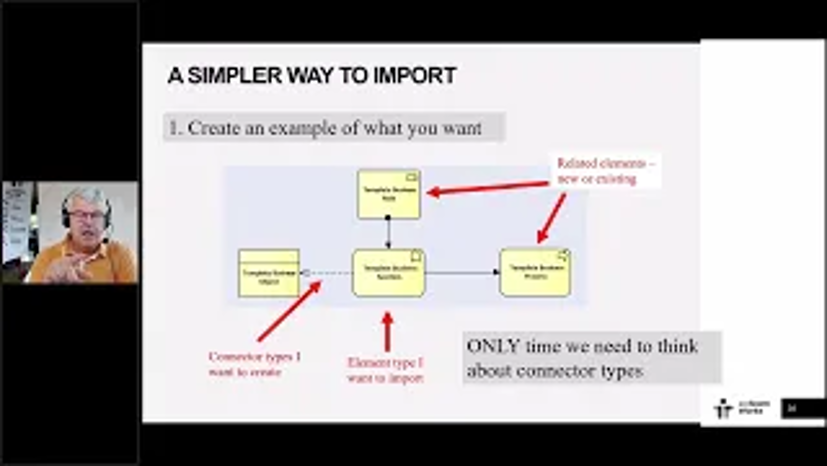
- First create a diagram with an example of the structure you want to import. The elements and their relationships. This example is a template. (This is the only time in all that follows that we need to think about connector types).
- Open the diagram or package as a Smart sheet. It’s in the eaSheets spreadsheet control embedded inside EA. It includes:
- The package
- The template element e.g. business function.
- Element notes, stereotype, a couple of tagged values and columns for each of the connectors to other objects. (relationship types are shown in the headers)
The template element is now row zero of the spreadsheet for the data to import.
- Copy and paste the data to be imported into the sheet. Drag copy and drag and renumber as well other standard spreadsheet features such as word wrap and changing widths of columns etc.
- Click to save into EA – the cell color changes to green to confirm all OK.
Check the results in EA
eaSheets creates a bunch of new elements, with all the content in the import sheet – descriptions, tagged values, and links to other elements. For the linked elements:
- When it finds an element with the correct name, it creates a connector to it.
- When it finds multiple things with exactly the same name in the model, it won’t create a connector to both of them but instead throws an error, because your model has multiple things with exactly the same name, stereotype and type which is confusing. Models using Time Aware Modeling may include examples of this – see Portfolio Manager™
(part of eaTeamWorks) for an alternative way to handle multiple versions in a single repository. - If it can’t find the element it’s looking for, it creates a new element of that type with a name as per the import sheet, and then creates the correct connector to that element
Conclusions
Re-import updated data and the same rules will apply, so no duplicate elements or connectors. In this way model data can be incrementally imported and retain its integrity.
Note that new elements are all created in the same package as the template element, so may need to be moved into the correct packages.
This provides an easy way to take highly denormalized data with bits and pieces from all over the place and importing into EA, just using a single diagram with a template bit of structure with the correct element types and connector types
Journey part 2.1: General Purpose Editor
eaSheets can do a lot more – making it a general-purpose editor of EA data.
- Add rows to add the same type of elements fast – copy fields from existing rows to
populate quickly. - Or give new elements different stereotypes.
- Delete elements (extra confirmation required).
- Delete connectors (eaSheets provides a warning before deletions).
- Add connections (by selecting new related elements from the EA browser).
- Show Tagged Values.
- Add new Tagged Values.
- Sort & filter.
- Import from Excel & export to Excel.
Using an EA diagram, we can see all the relationships of any element with “add related elements”. But, if a diagram shows an element with all its related elements, we must remember to manually refresh it after making any edits. Deleted connectors or related elements will be reflected, but not new ones. If we don’t refresh them, our diagrams will be wrong. Not obviously wrong, because they each look like a perfectly lovely diagram. But where a new connector exists that’s just like some of the other ones, it’s not on the diagram because the diagram is dumb. It only has what we put onto it.
Journey part 2.2: Validating EA data in eaSheets
Using a Model Expert Reference model we can validate any spreadsheet of EA data. To confirm if it is ‘structurally correct’. (It may be rubbish, but is it structural rubbish?)
Model Expert has reference models inside it that describe what elements and relationships are allowed and which tag values you need, what the values of those tag values can be… the
kind of stuff you find in an MDG. (PS reference models can be made from MDGs).
From the eaSheets menu, select Model Expert, choose the Reference model to apply, and errors on the spreadsheet are highlighted with color coded cells and pop ups that explain each error, have a link to your body of knowledge (in EA or an intranet site), and advice on what to do to fix it. All nicely linked together to encourage people to do the right stuff. But no diagram.
NB Model Expert has been validating diagrams with these kind of rules for five years. This is using exactly the same information. Model Expert says what what’s allowed and what’s not allowed, but here, applied to a spreadsheet. It shows where a value is not in the permitted range, of where something is missing, or where there are too many related elements. Or if
the wrong type of connector has been used.
With eaSheets, we can create, read, update, delete, connectors and elements and all the bits of elements, and can validate that it’s correct. And all without any diagrams.
(P.S. If you are using EA Time Aware modeling to model multiple versions of the same element, then validating with Model Expert will produce some strange results. And eaSheets
won’t know which elements to connect to when you are adding new relationships. There are several potential problems associated with the TAM naming protocol, so we recommend using Portfolio Manager™ to do it instead. PM will subtly rename every element that you that you clone, put a little* at the end of it to differentiate it from the original as well as linking back to it. Which avoids the name space collision.)
Journey part 3: What does that mean for how we use EA?
EA is a visual modeling tool. It’s the best visual modeling tool, it’s the cheapest, it’s just the best all round modeling tool. But it’s visual. It’s all about diagrams. Now we have eaSheets, what’s the role of diagrams in this new world?
We have a spectrum of diagrams, from the useful to the not very useful. The useful end is easy.
Sequence Diagrams, Activity and Process diagrams. You cannot imagine representing that information except in a diagram. It’s essential. These diagrams give you a visual kind of feel of where the responsibilities are, how things flow within the business or product. The spatial layouts and grouping things into swim lanes
etc are critical. So really, they’re not useful, they’re essential. Don’t even imagine doing that without a diagram. But as you look at the other kinds of diagrams that we draw, I think it’s not so obvious.
State Models. Anybody who’s been on one of my UML courses know I go crazy mad about state models because I love them, because I think they give really deep insight into behavior.
But could I do that in a spreadsheet? Probably not. Because I like to organize them to help people to understand what I’m doing and because that’s the game that we’re in, isn’t it? We’re about making sure it’s right in itself and putting across this information to other people. Using a spreadsheet to view a state diagram or a state model without any state diagrams
would be weird. We need to see which element, which state leads to each other state.
All the diagrams I’ve just talked about are behavioral. But as we move along the spectrum the diagram types get less behavioral and more structural. Is there a role for spreadsheets,
to view and manage the data easily? What about an ERD conceptual data model kind of thing? Can I imagine that in a spreadsheet?
Yes, I can. I can say it is almost certainly incomplete. With other kinds of classes not showing, so it could be a bit misleading. But I can arrange things in a spatial order that would help people understand it. I’m less convinced about those.
A personal favorite again for UML diagrams is a use case diagram and I’ve been teaching people this since UML was invented in the late 90s, So a very long time ago. The first time we built the EA sheets function I thought do I really need a Use Case diagram? If I could just open all these use cases in a sheet and include a column for each of the stakeholders. Maybe draw one or two use case diagrams if I’ve got a big model (hundreds and hundreds of use cases), but it might save me some time now to not draw use case model diagrams. Just open the use cases package in a spreadsheet and I can probably get more value there by checking is this connected to that, and does it have the right information in it?
As we approach the far end of the spectrum, we find many ArchiMate architecture diagrams. Firstly, there are the ‘everything on one page’ diagrams. Large, complex, and needing 2 days to explain. (Also called ‘look at me’ diagrams). Good for printing out and sticking on the wall behind my desk if I have a real desk. Or put them on the background for my zoom calls and people go, wow, Ian can draw diagrams like that. He must be smart. So that’s a good that’s a good use case for it.
But am I going to draw these such that every element appears in the right place in multiple diagrams? I don’t think so. I just don’t think I have that kind of time, not in the sizes of
models that I’m starting to see, where there are hundreds of business functions and there are many hundreds of business objects and business processes. These things do not scale into diagrams at all well. So every diagram now is some kind of super customized view. I’m putting those further to the right.
At the extreme, 2 of my least favorite EA diagrams.
- Why do I need a requirements diagram? I don’t think I do. I mean, these are kind of weird relationships in a way. This is made-up of those. OK, well, simple hierarchy, isn’t it? I can look at that in a tree view. I don’t need anything clever to look at that. Mostly I want a nice spreadsheet interface to manage it easily.
- Architecture maintenance diagrams, e.g. individual elements, and their relationships. Maybe child diagrams. Often generated by some bit of script or some smart person who has written some clever script to layout the elements beautifully. I’ve seen some fantastic bits of script that do this kind of stuff, because you must run it 400 times because you’ve got 400 of these and you produce 400 tiny diagrams which are immediately out of date. Because unless you’ve also got a mechanism of refreshing all 400 of them, whenever anybody adds a link here or a link there, they are wrong. (Or delete, remember EA will handle delete, the connection will have gone, so that’s good.) We could probably use the traceability view in EA and get the same information – probably more than I need, because it’s going to start showing me all these clever different kinds of connectors and things which I really don’t care about.
We don’t want Prolaborate to start having to suck these in and display them. We’re probably never going to put them into a document, because why would I when I can just put it as a textual table instead?
Now we’ve got this range of different kinds of diagram.
From the absolutely essential: things like process and sequence diagram, where the diagram really is the truth. If I miss a swim lane, or a sequence diagram lifeline or loop, then the diagram’s wrong. It’s got a big hole in the middle, and it’ll be obvious that I’ve just made a mistake. It’s very difficult to imagine a process diagram where I miss something out, so the diagram really is the truth. Otherwise, it makes no sense at all.
To the optional: The stuff at the other end, is very much a view of the truth, but not absolutely necessary for our modeling.
Don’t get me wrong here. If you think there is value in creating an architecture diagram or requirements diagram or something like that to illustrate a very particular point to clarify for a particular stakeholder, draw a diagram. And my general-purpose editor should make that very easy. From the spreadsheet, choose the bits that I want to see, and I throw them on the diagram. EA creates all the connectors for me. And if I’m lucky, it’ll lay the diagram out in some sensible way. More often it won’t look very sensible, but I’ll quickly be able to organize it and go.
A diagram that illustrates that point, but it’s a view of the truth. It’s not the truth. The model is the truth. At this end of the spectrum, a spreadsheet is often much closer to looking at the model than a diagram is.
Conclusions
At the useful, behavioral end of the diagram spectrum, I just stick to using diagrams and properties of things – regular EA stuff, business as usual. It’s at the other end where the data doesn’t have a natural kind of flow to it, isn’t spatially organized, where diagrams don’t really help me very much. That I think is where you need this kind of general-purpose editor.
If I don’t have any of these kind of maintenance diagrams (or viewpoints as ArchiMate calls them), instead I just open a sheet on a whole bunch of business functions or business roles. Then I don’t have to create diagrams. I don’t have to keep them refreshed, and I can keep validating them so I can get more done with less effort and greater accuracy.
The other thing we can do is hide the complexity of different connector types. When a user looks at those spreadsheets, they don’t need to know what kind of connector exists between the different elements. The information is there, in the heading at the top just for the geeks amongst us, but for non-modeler stakeholders, they can just type in the name of the thing and eaSheets creates a connection to it. So it makes this kind of information, the non-diagrammatic information, much more accessible to different kinds of stakeholders.
We think there’s a bunch of people who would probably use an interface like this that would never dream of using Enterprise Architect to draw diagrams with clever links, pop ups and quick linkers and all that stuff. Some people find that very scary about EA because they don’t know it. You know, to know it is to love it, but selling that to new people is hard. Now we can say, hey look, here’s a spreadsheet, just fill in the bits that you know, and we’ll figure out the rest with you. Just take a copy of it into Excel, give it to somebody who knows, get them to type in the right names, bring it back. Easy. At no point do they have to know what Archimate means or what an ArchiMate triggering connector means.
Which brings me to the realization at the end of this journey: “Hey, if I can do that, what other kinds of data can I put into EA that I couldn’t do before?”
EA lets us put ArchiMate and Zachman and all those kinds of stuff into it. It’s a tribute to EA’s flexibility. But I think there’s more kinds of stuff we can put into EA if we don’t have to invent and draw a diagram and put things in the right places and connect them the right way. We can just use a spreadsheet and fill it in easily.
What does that let us do? If we have a bunch of people who are currently spreadsheet users, we can get these people now into the EA world a lot easier than we could if they had to draw diagrams. Might they go the next step and rather than maintaining all their data in spreadsheets in Excel in their own silo, why not use this spreadsheet in EA, which is nice and simple? It’s got just the data that they need, columns that they understand, and they can add rows and add columns and select things and sort and filter and stuff. A usable interface that means other pieces of data can be mastered in EA rather than doing it externally? Which avoids regular imports and reconciling all the changes and all that sort of stuff. And with all the spare time we’ve got, we can now just draw diagrams where it really helps people to understand what’s going on.

eaSheets, part of eaTeamWorks
All the spreadsheet and validation functions demonstrated in this video are part of eaTeamWorks.
The whole EA Teamworks suite is now a single add in containing: eaSheets, eaDocX, Model Expert, Revision Manager and (coming soon) Portfolio Manager. Available to download and including a free 30-day trial of each product.
Buy licenses for the whole suite, or individually for the bits you need. See the prices here.
Thanks for watching.
About Ian
An EA user since version 3.5 and 40 years working in the IT industry. I’ve been a business analyst, I was even a project manager for two days, a manager of BA teams, I’ve taught UML, written UML courses, and for the last 12 years I’ve been the author of eaDocX, Model Expert, Revision Manager and Portfolio Manager which are now part of eaTeamWorks.
More Insights
Maintaining Attribute Level Mappings
1 July 2025
Using eaSheets to maintain attribute level mappings modeled using the special attribute/attribute connectors in EA
Learn MoreeaSheets Walkthrough
5 October 2023
eaSheets features walkthrough: An introduction to some basic eaSheets features.
Learn MoreUsing Excel to edit and compare EA data
27 September 2023
eaSheets is a fast and effective alternative to the Microsoft Office MDG for Enterprise Architect modelers
Learn MoreAlternative Integration for Microsoft® Office - Excel Importer
14 September 2023
In this video we show how you can quickly import spreadsheets containing elements and connectors from Excel into Enterprise Architect.
Learn MoreAdding data to an eaSheets 'Smart Sheet'
18 August 2023
Adding data to an eaSheets 'Smart Sheet'
Learn MoreTemplate elements for importing complex data with eaSheets
18 August 2023
A really quick way of importing complex data using eaSheets
Learn MoreValidating Sparx EA data
16 August 2023
Use eaSheets and Model Expert to view, edit and validate your EA data.
Learn MoreSuper fast editing
11 August 2023
eaSheets bring the power of a spreadsheet to the editing of EA data. Keep your models up-to-date and consistent, quickly and easily.
Learn MoreWhat's so smart about Smart Tags?
17 May 2023
What are Smart Tags for Sparx Enterprise Architect and what benefits do they deliver for modelers?
Learn More
Take a free, no obligation, 30-day trial of eaSheets. eaSheets is part of eaTeamWorks, so you can also trial eaDocX, Revision Manager, Model Expert and Portfolio Manager. Plus free for life EA modeling features. Discover for yourself the difference that working with eaSheets will make to your EA modelling.
Download